
Page 50 - aq_mrsc_eng_af2low
P. 50
In the Schools of Management and Corporate Schools training are managed by Aqualia and they impart specific technical training
aimed at managers and personnel with high potential and in the water sector as well as specific needs.
transversal training (values a nd corporate processes, skills,
languages a nd office technology) is provided. Knowledge Schools
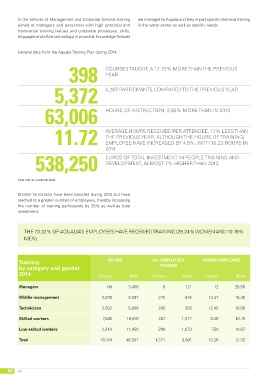
General data from the Aqualia Training Plan during 2014:
398 Courses taught, a 12.75% more than the previous
5,372 year
63,006 4,287 participants compared to the previous year
11.72
538,250 hours of instruction, 3.85% more than in 2013
average hours received per attendee, 17% less than
the previous year, although the hours of training/
employee have increased by 4.5%, with 10.23 hours in
2014
euros of total investment in people training and
development, almost 7% higher than 2013
Data only at a national level.
Shorter formations have been boosted during 2014 but have
reached to a greater number of employees, thereby increasing
the number of training participants by 25% as well as total
investment.
THE 70.32% OF AQUALIA’S EMPLOYEES HAVE RECEIVEDTRAINING (29.24% WOMEN AND 70.76%
MEN).
Training HOURS No. EMPLOYEES HOURS/EMPLOYEE
by category and gender TRAINED
2014
Female Male Female Male Female Male
Managers 60 3,456 12 28.56
Middle management 9,097 5 121 13.48
Technicians 3,978 5,908 14.47 16.68
Skilled workers 2,552 16,976 275 675 12.45 10.76
Low-skilled workers 7,286 11,450 10.67
Total 2,243 46,887 205 355 9.26 12.33
16,119 7.50
787 1,577 10.26
299 1,073
1,571 3,801
50 HR