
Page 65 - Aqualia MRSC 2015
P. 65
G4-LA6 09
Health at work
One of the company's aims is to create a of them. When interpreting the data it is
work environment that protects, promotes important to take into account that the
and supports the physical, mental and social figures given are within the confidence
well-being of its employees. In addition, intervals of a statistical trend, therefore,
employees are made aware of and are it would not be correct to discuss im-
trained on occupational safety, ensuring provements or downturns. Meanwhile,
compliance with current legislation. absenteeism in Spain increased in 2015 as a
To this end, throughout 2015, various result of the socio-economic conditions and
measures were adopted to reduce the most as a counterbalance to the sharp decline
significant rates; however, despite these recorded in the last 5 years.
efforts, a slight increase was noted for all
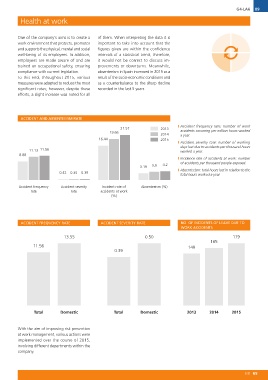
ACCIDENT AND ABSENTEEISM RATE
11.13 11.56 21.57 2013 ❙❙ Accident frequency rate: number of work
8.88 19.66 2014 accidents occurring per million hours worked
16.44 2015 a year.
Incident rate of 3.19 3.9 4.2 ❙❙ Accident severity rate: number of working
accidents at work days lost due to accidents per thousand hours
0.42 0.35 0.39 worked a year.
(%)
❙❙ Incidence rate of accidents at work: number
of accidents per thousand people exposed.
❙❙ Absenteeism: total hours lost in relation to the
total hours worked a year.
Accident frequency Accident severity Absenteeism (%)
rate rate
ACCIDENT FREQUENCY RATE ACCIDENT SEVERITY RATE NO. OF INCIDENTS OF LEAVE DUE TO
WORK ACCIDENTS
13.55 0.50
0.39 179
11.56 165
149
Total Domestic Total Domestic 2013 2014 2015
With the aim of improving risk prevention
at work management, various actions were
implemented over the course of 2015,
involving different departments within the
company.
HR 65