
Page 72 - 2016 CSR Report
P. 72
IMPLICATIONS OF
GLOBAL WARMING
One of the main lines of action in the environmental management system
is the knowledge of the impact on climate change by Aqualia’s activity and
its mitigation.
The implementation and certification of the environ- For this reason and within the framework of the
mental (ISO 14001) and energy (ISO 50001) mana- FCC Group’s 2020 climate change strategy, Aqualia
gement systems not only involved the improvement has worked since 2012 on the continuous improve-
of the efficiency in the use of energy sources but ment of its integrated management system with
also directly contributed to the fight against global the fundamental objective that includes both the
warming by reducing the emission of greenhouse management of the quality of processes, products
gases to the air. and services and environmental management.
MEASUREMENT OF THE CARBON
FOOTPRINT IN THE ENTIRE ACTIVITY
For the third consecutive year, Aqualia has calcu-
lated the carbon footprint for the entire activity
of managing the integrated water cycle in the The energy efficiency measures imple-
company. The calculation was verified by AENOR mented contributed to a reduction of
and entered in the carbon footprint register of the 15.5% of total CO emissions to the air
2
Ministry of Agriculture and Fishing, Food and the in 2016.
Environment.
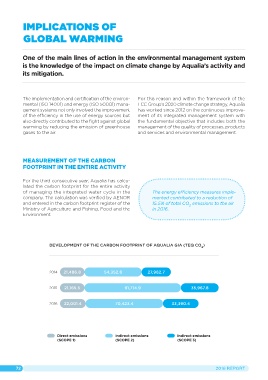
DEVELOPMENT OF THE CARBON FOOTPRINT OF AQUALIA GIA (TEQ CO )
2
2014 21,486.8 54,352.8 27,982.7
2015 21,165.5 91,714.9 35,967.8
2016 22,001.4 70,423.4 33,390.4
Direct emissions Indirect emissions Indirect emissions
(SCOPE 1) (SCOPE 2) (SCOPE 3)
72 2016 REPORT