
Page 85 - RSC Aqualia 2017
P. 85
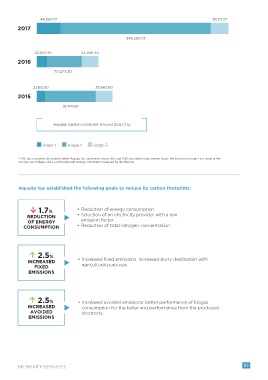
46,158.07                                                                   35,121.37
         2017

                                                         345,200.13


                22,001.40            33,390.40
         2016

                         70,423.40


                21,165.50                  35,967.80
         2015

                             91,714.90


                         Aqualia Carbon Footprint Record (teq CO2)


                    Scope 1    Scope 2    Scope 3


         * 2017 data concerns all countries where Aqualia has a presence versus 2015 and 2016 data which only concern Spain. The increase in scope 2 is a result of the
         incorporate of Algeria data and the elevated energy consumption required by desalination.


         Aqualia has established the following goals to reduce its carbon footprints:


                  1.7%             • Reduction of energy consumption.
             REDUCTION             • Selection of an electricity provider with a low
             OF ENERGY               emission factor.
           CONSUMPTION             • Reduction of total nitrogen concentration.


                  2.5%
             INCREASED              • Increased fixed emissions: increased slurry destination with
                FIXED                 agricultural purposes.
              EMISSIONS


                  2.5%              • Increased avoided emissions: better performance of biogas
             INCREASED                consumption for the boiler and performance from the produced
              AVOIDED                 electricity.
              EMISSIONS


         06 SMART SERVICES                                                                                   85