Page 72 - Aqualia MRSC 2015
P. 72

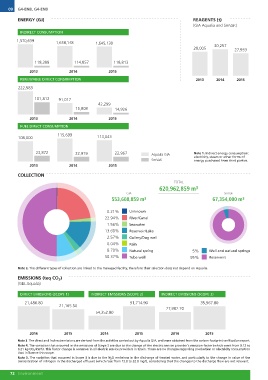
09 G4-EN8, G4-EN9                                                                                   REAGENTS (t)
      ENERGY (GJ)                                                                                   (GIA Aqualia and SmVaK)

INDIRECT CONSUMPTION

1,570,639            1,658,148           1,645,130

                                                                                                    28,005                           30,257  27,933

           118,399              114,857              118,813
                                                  2015
2013                        2014
                                         42,299
RENEWABLE DIRECT CONSUMPTION                          14,926                                        2013                             2014    2015

222,583                                           2015

           101,812   91,017              113,043
                                 15,808

2013                        2014

FUEL DIRECT CONSUMPTION

108,000              115,699

             23,872             22,919             22,967                        Aqualia GIA        Note 1. Indirect energy consumption:
                            2014               2015                              SmVaK              electricity, steam or other forms of
          2013                                                                                      energy purchased from third parties.

COLLECTION

                                                             GIA                             TOTAL                                              SmVak

                                               553,608,859 m3                    620,962,859 m3                                      67,354,000 m3

                                          0.21%               Unknown                                5%                              Well and natural springs
                                         22.94%               River/Canal                           95%                              Reservoirs
                                                              Seawater
                                          1.56%               Reservoir/Lake
                                         13.60%               Gallery/Dug well
                                                              Rain
                                          2.57%               Natural spring
                                          0.04%               Tube well
                                          8.70%
                                         50.37%

Note 2. The different types of collection are linked to the managed facility, therefore their selection does not depend on Aqualia.

EMISSIONS (teq CO2)
(GIA Aqualia)

DIRECT EMISSIONS (SCOPE 1)               INDIRECT EMISSIONS (SCOPE 2)            INDIRECT EMISSIONS (SCOPE 3)
                                                                      91,714.90
21,486.80            21,165.50                                                                           35,967.80
                                            54,352.80
                                                                                 27,982.70

2014                  2015               2014                 2015                            2014        2015

Note 3. The direct and indirect emissions are derived from the activities carried out by Aqualia GIA, and were obtained from the carbon footprint verification report.
Note 4. The variation that occurred in the emissions of Scope 3 are due to the change of the electric service provider's emission factor (which went from 0.12 to
0.21 kg CO2/kWh). This factor change is common in all electric service providers in Spain. There are no changes regarding production or electricity consumption
that influence this scope.
Note 5. The variation that occurred in Scope 3 is due to the N2O emissions in the discharge of treated water, and particularly to the change in value of the
concentration of nitrogen in the discharged effluent (which rose from 13.8 to 22.8 mg/l), considering that the changes to the discharge flow are not relevant.

72 Environment
   67   68   69   70   71   72   73   74   75   76   77